Markets Run on Stories. Can You Measure One?
Every bubble and every panic is, underneath the price action, a story spreading through a population. “AI will eat everything.” “Regional banks are insolvent.” “Office is dead.” The story arrives, a few people believe it, then more, then it’s everywhere — and then, often suddenly, it isn’t. Prices follow the story up and follow it back down.
That shape — slow formation, fast acceleration, a peak, then a collapse — is the same shape an epidemiologist sees in an outbreak. So I spent a stretch of nights asking a concrete question: if a narrative spreads like a contagion, can you borrow the math of contagions to measure where one is in its life?
This is a write-up of that research lab. It is exploratory work, not a product and not a track record — I’ll be precise below about what’s real and what’s still a hypothesis.
The core idea: a narrative is an epidemic of belief
The workhorse model in epidemiology is SIR — a population split into the Susceptible, the Infected, and the Recovered. Reframe the labels for a market: Susceptible are people who haven’t heard the story, Believers are those currently holding it and acting on it, and Disillusioned are those who’ve moved on. The same equations that govern a flu season then describe the life of a narrative.
Run that model and you get a characteristic curve:
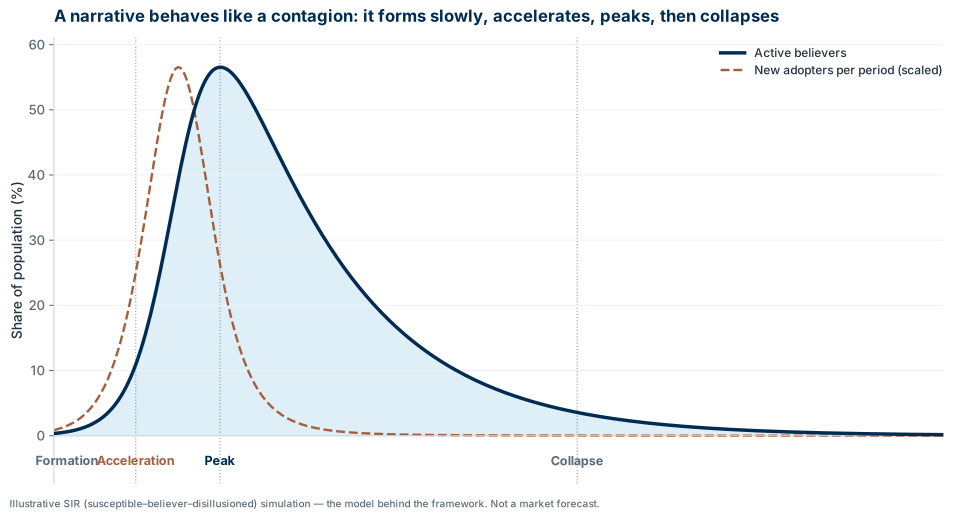
The interesting structure isn’t the rise or the fall on their own — it’s the relationship between them. The rate of new adopters peaks well before the total believer count does. In market terms: the narrative looks healthiest (price still climbing, everyone talking about it) at the very moment its underlying recruitment has already started to decay. Tops are quiet failures of inflow, not loud events.
What the framework actually computes
A pretty curve proves nothing. The real work was wiring this intuition to live, public data — yfinance for prices and volume, GDELT for the global news stream, SEC EDGAR for filings and earnings tone, FRED for the macro backdrop — and computing a stack of signals across roughly a dozen asset classes:
| Signal | What it measures |
|---|---|
| Composite Cascade Indicator | A 0–1 score blending momentum, volume, RSI, volatility, and correlation to place an asset in a phase: forming, peaking, collapsing, or calm. |
| Narrative Fragility Index | Six components (duration, breadth, volume, volatility, momentum, mean-reversion pull) ranking which narratives are most vulnerable to a break. |
| Cross-Asset Regime Detection | A read on the whole tape — risk-on vs. fear, inflation vs. growth — from twelve asset-class proxies. |
| Contagion Networks | Hand-mapped chains (AI infrastructure, rate sensitivity, inflation, CRE, deglobalization) tracing how a shock in one node propagates to its neighbors. |
| Contrarian Timing | A capitulation / exhaustion / stabilization classifier for the recovery side — when a collapsed narrative is finally washed out. |
Each runs on real data and produces a real number. The framework was also validated against known historical cascades — the dot-com bubble, the 2008 housing collapse, the GameStop episode, the recent AI-infrastructure run — to check that it would have flagged the phases in roughly the right order.
What’s real, and what’s still a hypothesis
Intellectual honesty is the whole point of a lab like this, so here is the line, drawn plainly:
- Real: the signals compute on live public data; the cascade, fragility, and regime scores are genuine outputs; the historical-cascade validation runs.
- Hypothesis: this has never traded a dollar. Forward predictive power is unproven — historical fit is not the same as out-of-sample edge. Some pieces are deliberately synthetic or hand-built: the agent-based network experiments use simulated topologies, and the contagion chains are hypothesized paths, not relationships learned from data.
So I treat it as a thinking instrument, not a signal service. Its value to me is that it forces a rigorous, quantitative version of a question every allocator should ask — not “is this true?” but “where is this story in its life, and who’s left to convince?”
That reflexive question — markets moving on beliefs about beliefs — is older than any model. What’s new is that a single person can now wire public data streams into a working apparatus for studying it over a few nights. Whether it ever earns a place in a live process is an open question. Building it sharpened how I think about every crowded trade I look at, which was the point.